What the Heck Is an Equidistant Channel?
Equidistant channels are arguably the most common technical structure found in the Forex market. Not only that but they are, in my experience, one of the most lucrative to trade.
Simply put, it’s the visual representation of consolidation – a period where indecision between the bulls and the bears holds the market to a range. The pattern typically forms following an extended move up or down when consolidation is most likely to occur.
More often than not, these structures eventually break in the direction of the prevailing trend, which is what gives them the reputation of being a continuation pattern.
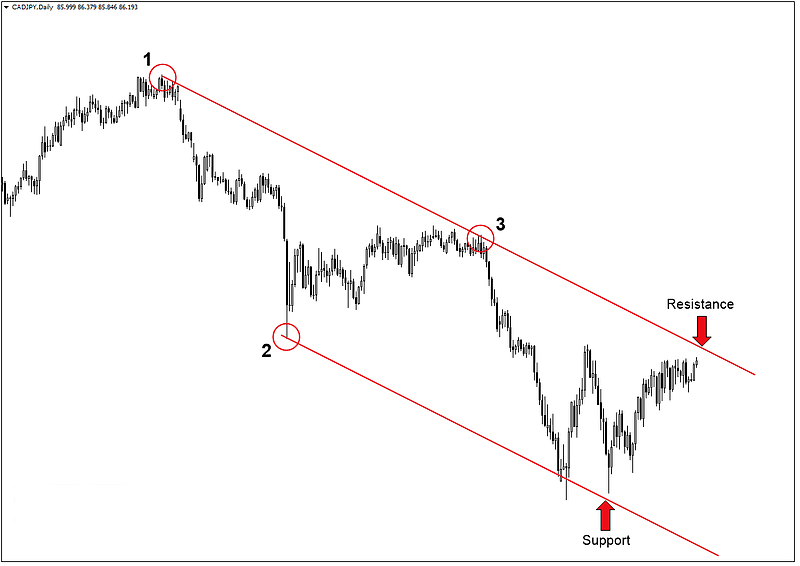
The image below illustrates the characteristics of a typical equidistant channel.
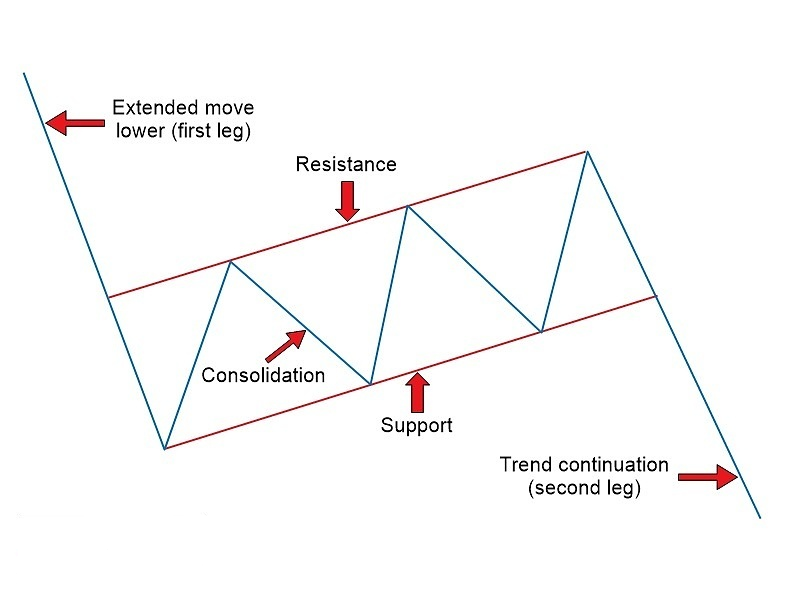
Note that we have the extended move lower, what I often refer to as the “first leg” of the pattern. We also have support and resistance followed by the second leg lower in the direction of the prevailing trend.
The GBPNZD 4-hour chart below is an excellent real-world example of how these formations typically unfold.
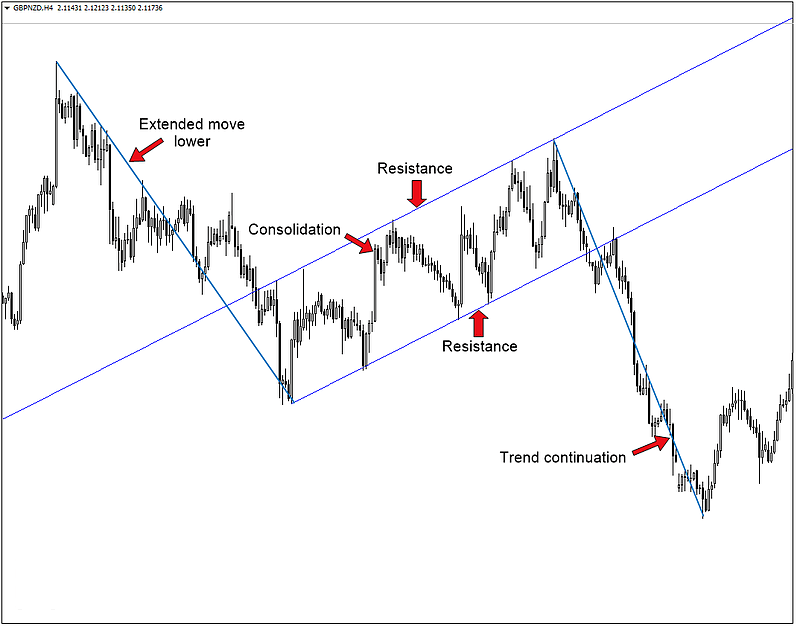
Pretty basic stuff, right?
Trend, consolidate, trend.
Okay, good. Now let’s discuss the most common way of trading the equidistant channel.
Using Equidistant Channels to Find Trade Setups
The first thing you want to know about finding trade setups within an equidistant channel is that you always want to try to trade with the trend. A channel is essentially just a trending market, so the same rules apply when it comes to trading with the momentum.
This is true so long as the market remains within the channel. There are exceptions to this rule, which we will take a look at later in the lesson.
Let’s take another look at the GBPNZD example to see if we can find a bullish signal at support.
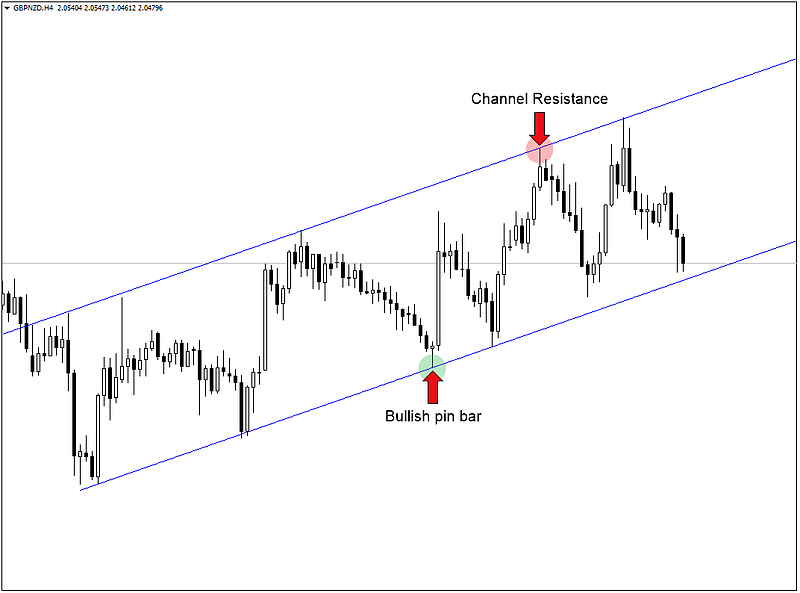
Notice how in the chart above, after two touches off of support, the market formed a bullish pin bar. This pin bar formed within the uptrend of the equidistant channel and therefore represents a valid buying opportunity.
The logical target for this trade was channel resistance, which took the market 3 days to reach.
Note: This trade endured a significant pullback along the way. However, it was still extremely profitable for the disciplined trader.
Speaking of being profitable, let’s see what this trade amounted to in terms of a risk to reward ratio.
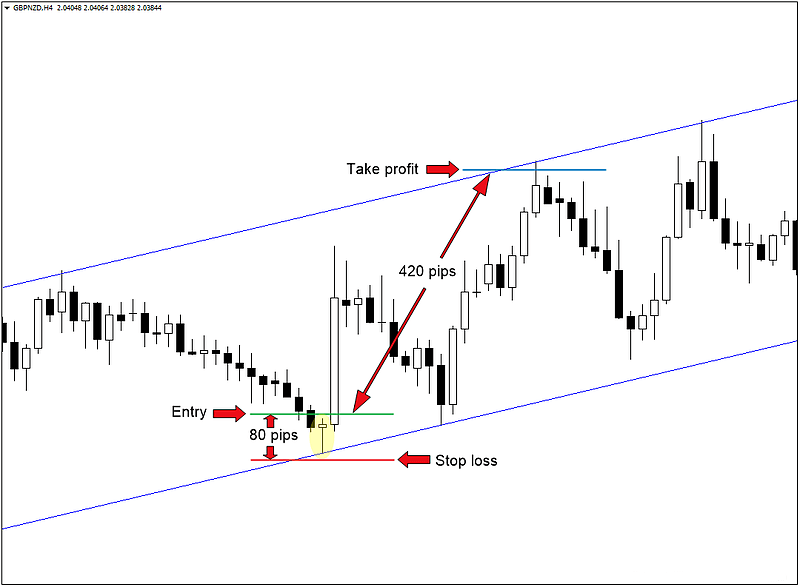
In the trade setup above, the bullish pin bar required an 80 pip stop from the entry to the stop loss placement. The profit target on the other hand, which was channel resistance, was approximately 420 pips away.
The risk to reward ratio for this trade setup was 1:5.25 (420 / 80). Put another way this was a 5.25R trade. So if you had risked $100 you would have made $525 ($100 x 5.25). Not bad for a trade that took just 3 days.
The Conventional Approach (Don't Skip This)
We now know that channels serve as a way to identify consolidation, which is the visual representation of indecision. We also know that this indecision often occurs after a sharp, extended move up or down. However, the real benefit of these patterns is not so much the consolidation itself, but rather the price action that follows.
Equidistant channels can be great for finding trade setups within the channel, but what happens when the market breaks support or resistance?
When this happens, we can essentially treat it similar to the Forex breakout strategy. This means that we’re watching for a break of support or resistance with the intent of trading in the direction of the break. It should be noted that these breaks are best traded as follows:
- Ascending (bullish) channel – look for a break of channel support
- Descending (bearish) channel – look for a break of channel resistance
Let’s take a look at a break of channel support that occurred during an equidistant channel.
The chart below illustrates this point.
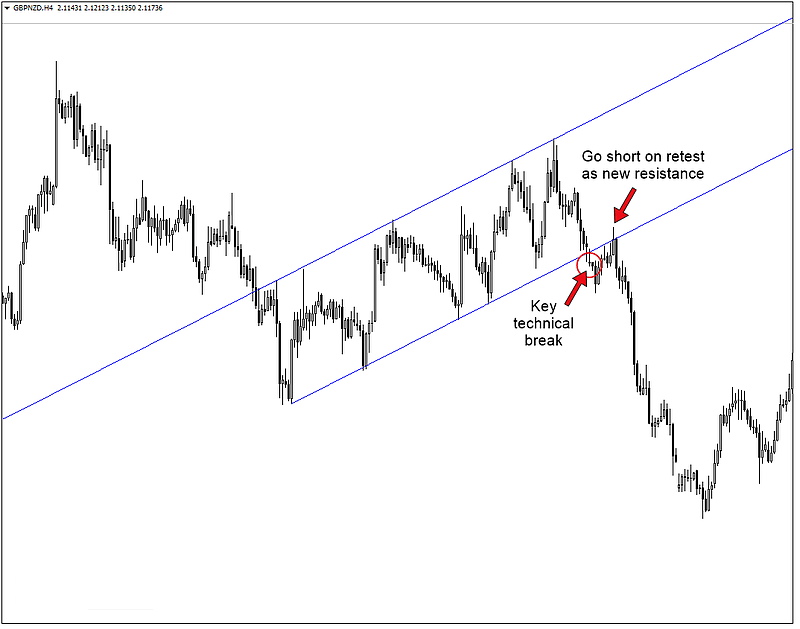
Notice how, following a break of support, GBPNZD retested the broken level before continuing in the direction of the primary trend. That retest is a channel trader’s dream. It allows for a precise entry into the market where the potential reward is far greater than the risk. For this reason, channels have become one of my favorite technical patterns to trade.
They also occur much more frequently than most Forex traders realize. In fact, the next time you look at your charts, pay close attention to periods of consolidation to see if you can identify any channels. I think you’ll be surprised at how many you can find. And once you become proficient at spotting them, you will begin to see the next section of this lesson in a whole new light.
Using Channels to Form a Directional Bias
Another way to use an equidistant channel is to form a directional bias for a particular market. This is achieved by applying the channel to a higher time frame such as the weekly chart.
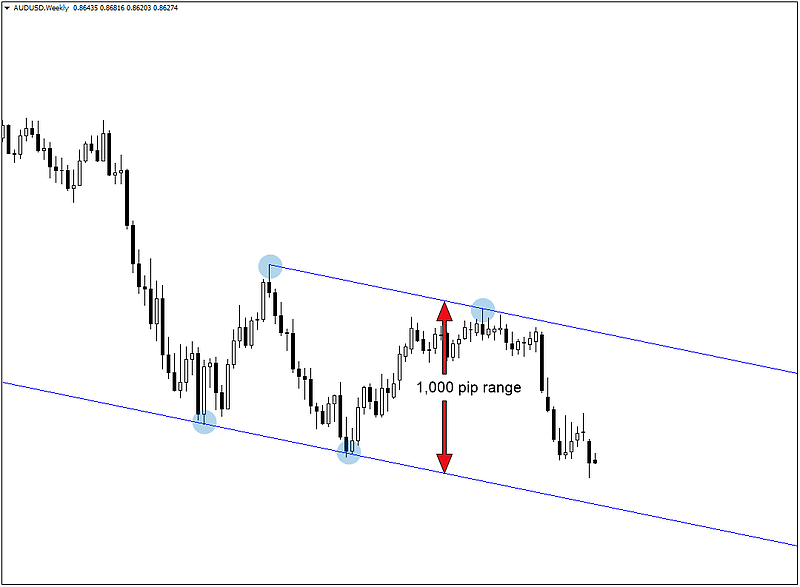
The chart above shows the AUDUSD weekly chart. The pair is currently moving within an equidistant channel with a 1,000 pip range. This is important because it allows us to form a bullish or bearish bias depending on where the market is within this channel. A move down to channel support would have us looking for a potential reversal on the daily time frame.
Alternately, a move below channel support would have us looking lower, while a move above channel resistance would have us searching for long opportunities on the daily chart.
Think of using equidistant channels in this way as another tool by which you can shift the odds in your favor. If you know where a market is likely to move on a weekly basis, it becomes much easier to trade with the trend on the daily and 4 hour time frames.
A Unique Way to Trade with Equidistant Channels
I would bet that the majority of you are familiar with channels in one form or another. Even if you aren’t quite sure how to trade them, you, at least, know they exist.
But what I’m about to show you may not be so familiar, even to those who have previously traded these patterns for their breakout potential. Aside from the effectiveness of trend lines, this unconventional approach to utilizing channels is what convinced me many years ago that ignoring diagonal levels would be a mistake.
But first things first, to use this technique, you need two critical elements:
- A currency pair that has formed a higher low or a lower high
- A swing high or swing low that compliments #1
The illustration below shows the two elements I just mentioned for both the ascending channel as well as the descending channel.
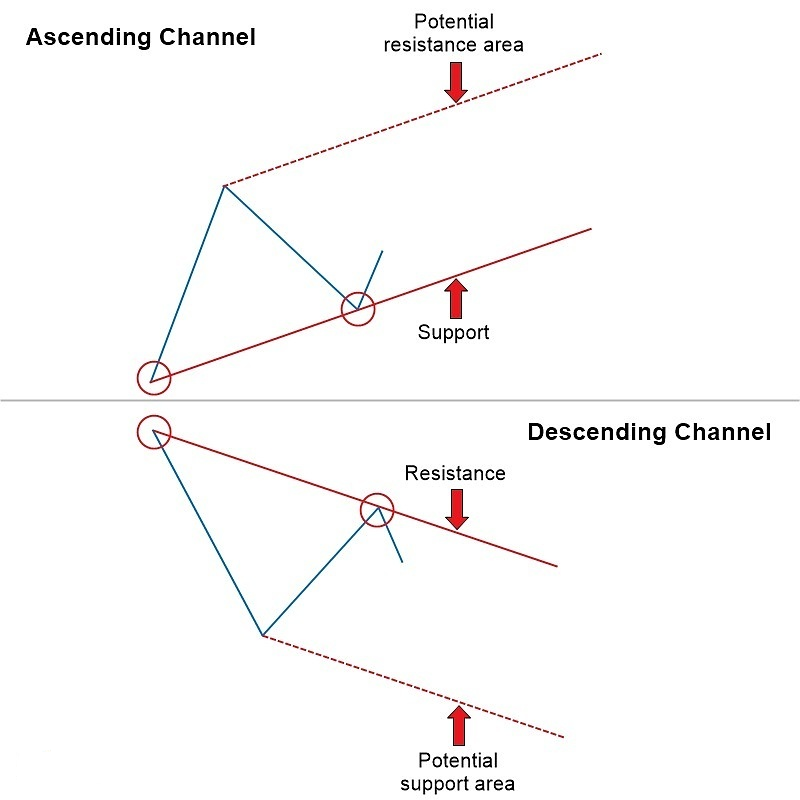
Notice how, with the ascending channel above, we have a higher low which formed trend line support. We also have a complimentary swing high that we can use to anticipate where resistance might come into play.
The same goes for the descending pattern, only in this case we have a lower high along with a complimentary swing low which we can use to determine a future support area.
The basic premise here is that we are using what we already know about the pattern to anticipate a future (potential) area of support or resistance.
This simple yet effective way of spotting potential support or resistance can be an excellent way to determine when to take profit. And as previously mentioned, it’s also a great way to find possible areas to enter long or short.
The EURUSD daily chart below is a perfect real-world example of how to anticipate a future resistance level before it fully materializes.
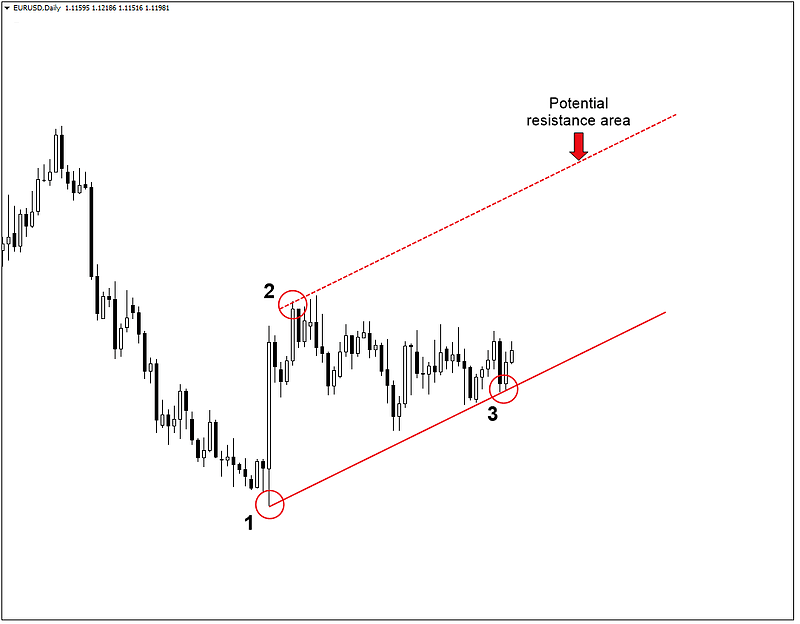
Notice how we are using what we already know about channels to draw a parallel line next to an already established trend line. Also, note that we have the two critical elements mentioned above, which gives us our three points needed to utilize this method successfully.
The EURUSD chart below shows what happened after a short period.
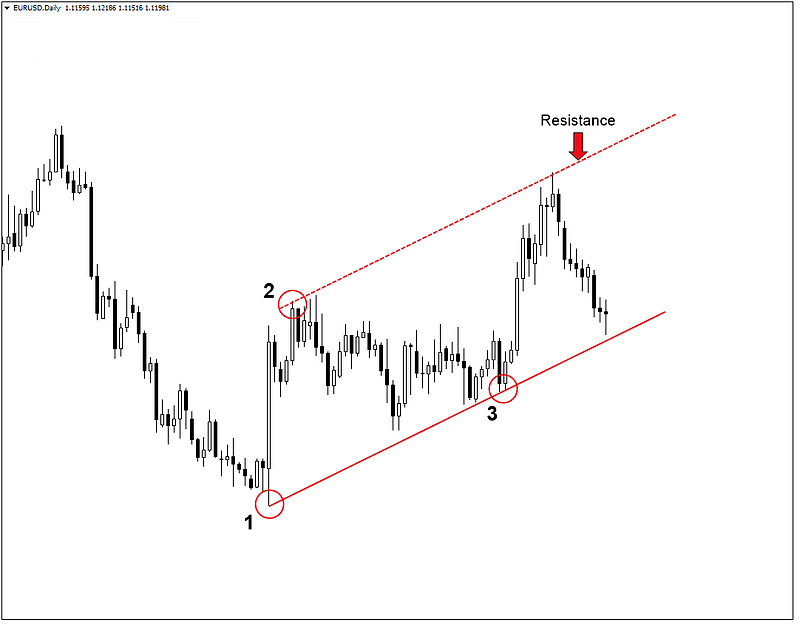
Based on the chart above, EURUSD did indeed find selling pressure in this area. So not only could we have used this level to take profit, but we now have a valid ascending channel from which to trade.
The key to finding success with this is to only use major swing highs and lows. In other words, the three points you use to draw your levels should stick out like a sore thumb.
If you find yourself struggling to come up with valid highs and lows from which to draw your levels, you’re doing something wrong. Take a step back, move to a higher time frame and focus only on those currency pairs that are trending.
Now let’s take a look at something a little different. It’s the same technique, but in this case, the pattern formed in an unusual order. In the AUDNZD 4-hour chart below, the pair formed a swing high followed by a swing low which was followed by a higher low. Although the sequence is different, we still have the necessary three points to draw our levels.
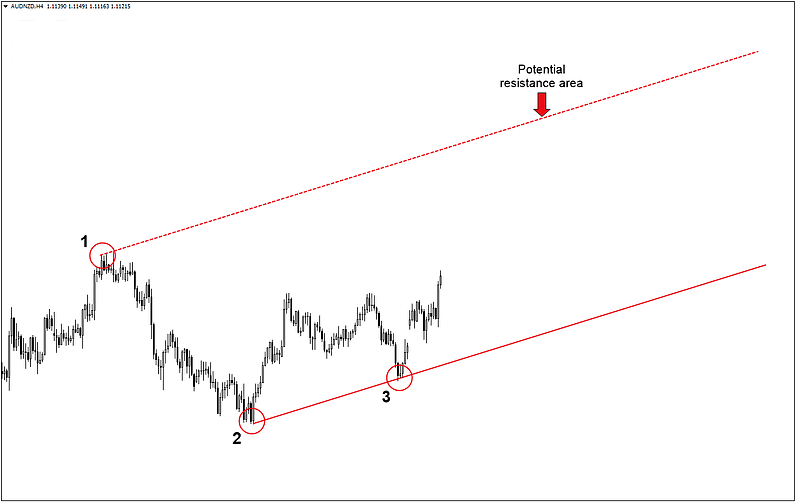
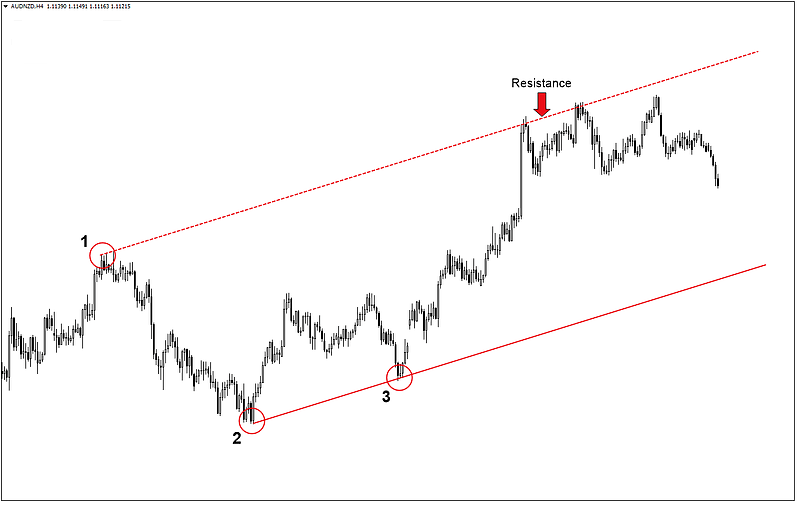
Notice how, once again, the pair found selling pressure at the level we suspected would attract offers.
Last but not least, let’s look at a bearish market where this method would have suggested a potential support area.
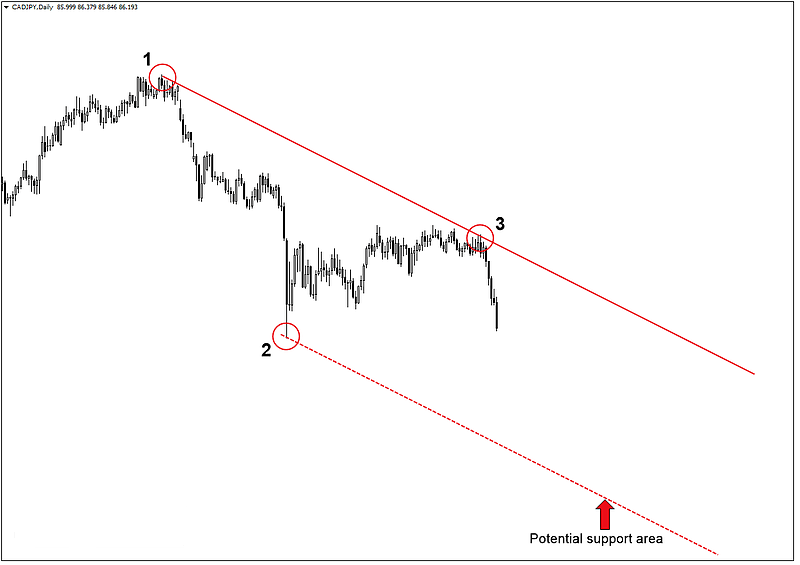
Once more, we have our three points, a swing high followed by a swing low as well as a second swing high which was lower than the first. We now have a clear area which we can use to take profit (if short) or even watch for a buying opportunity once the level has a chance to influence price action.
As suspected, CADJPY found a bid at this area and rocketed higher shortly after.
Conclusion
The equidistant channel is one of my favorite technical patterns due to its frequent occurrence, time frame neutrality, and reliable outcome.
While buying or selling a breakout from an established channel can be extremely profitable, using what we already know about how they form, we can also use them to identify future areas of support or resistance.
All you need to determine the area of value is three points, two that form a trend line (first level) and another that acts as the swing high or swing low (second level).
Just like anything else in the world of Forex, using channels in this manner is not a perfect science. While they have an uncanny ability to find “hidden” profit targets, there will always be times when the market doesn’t play nice.
For this reason, it’s best to treat this as yet another tool in your trading toolbox rather than the end-all-be-all indicator of a market’s future direction.
To sum up, the main difference between the two approaches above is that one uses an established channel from which to trade a breakout while the other anticipates the formation of a channel which acts as an early warning sign that market sentiment is about to flip.
At the end of the day, the way in which you choose to incorporate this into your current style of trading, if at all, is entirely up to you.Like anything in the world of trading, this is not a foolproof system. There will be times when the market doesn’t reach the second parallel level or just doesn’t respect it as support or resistance.
But that’s okay. As long as you are utilizing other means of identifying key levels and managing your risk, you will never be 100% reliant on this one technique. Watch the equidistant channel video below for more information.
The best defense against false positives with any method or technique is a well-rounded approach to technical analysis.